Building a Serverless Fitness Shop - Observability
Embark on the serverless observability journey with ACME Serverless Fitness Shop. Learn how VMware Tanzu Observability by Wavefront enhances the Cloud-Native experience through logs, metrics, and traces.
If you’ve read the blog posts on CloudJourney.io before, you’ve likely read the term “Continuous Verification”. If you haven’t that’s okay too. There’s an amazing article from Dan Illson and Bill Shetti on The New Stack explaining in detail what Continuous Verification is. In a nutshell, the Continuous Verification comes down to making sure that DevOps teams put as many checks as possible into their CI/CD pipelines. Adding checks into a pipeline means there are fewer manual tasks and that means you have access to more data tot smooth out and improve your development and deployment process.
So far we covered the tools and technologies, Continuous Integration, and Infrastructure as Code aspects of the ACME Serverless Fitness Shop. Now, it’s time to dive into observability!
What is the ACME Serverless Fitness Shop
Let’s go over what the ACME Serverless Fitness Shop is just one more time. It’s a shop combines the concepts of Serverless and Fitness, which are two of my favorite things, because combining two amazing things can only lead to more amazing outcomes. There are seven distinct domains, that all contain one or more serverless functions. Some of these services are event-driven, while others have an HTTP API and all of them are written in Go.
What is Observability
Cloud-Native apps have changed the way we think about building apps and running apps. It has fundamentally changed the way we design systems. Cloud-Native systems need to be able to adapt to change rapidly, need to be resilient, and should work on a large scale. Cloud-Native apps are deployed as a set of microservices, whether you run those on a Kubernetes cluster or as serverless functions. Some companies have hundreds of microservices in production and deploy thousands of times per day. The ever-growing collection of microservices makes applications a lot more complex. One of the biggest challenges with microservices, is figuring out how and where things go wrong. Wikipedia describes Observability as “a measure of how well internal states of a system can be inferred from knowledge of its external outputs”.
Within the context of distributed systems, observability is usually described as having three separate pillars. Logs, metrics, and traces make up the information that makes a distributed system observable. Based on those three elements, you can infer what’s going on. Logs are the, usually, immutable records that an app sends somewhere to be stored. The ACME Serverless Fitness Shop uses AWS CloudWatch Logs for that purpose. CloudWatch Logs gives you a single place to go look for all the logs of all components of the system. If you want to find the messages received by the AWS API Gateway, you can find them in CloudWatch Logs. If you need to find messages from a particular AWS Lambda function, you can find them in CloudWatch Logs. The data that is logged to CloudWatch Logs is automatically indexed and queryable. That makes it a lot easier to find that needle in the haystack. Metrics represent the numerical values of the data you, well, measure. There are many different types of metrics that an app might emit. For example, within VMware Tanzu Observability by Wavefront there are metrics types to show the current value of something (like current CPU load) or increasing or decreasing values (the number of concurrent executions). The third “pillar”, traces, represent the different events that occur within a system. These are the events that flow from microservice to microservice and contain data that makes it easy to find an event. An end-to-end trace contains data that starts at the first entry point to your app (usually the user interface), keeps track of all the other microservices it touches and keeps track of how long each call lasted. The article “How to Use Tracing to Analyze Your Applications” gives a great overview of how you can use tracing to find the outliers, error, and overall traffic of your microservices.
Adding VMware Tanzu Observability by Wavefront
Adding the observability tools offered by VMware Tanzu Observability by Wavefront to the ACME Serverless Fitness Shop is not that difficult.
package main

import (
	"github.com/aws/aws-lambda-go/events"
	"github.com/aws/aws-lambda-go/lambda"
	wflambda "github.com/retgits/wavefront-lambda-go" // Import this library
)

var wfAgent = wflambda.NewWavefrontAgent(&wflambda.WavefrontConfig{})

func handler() (string, error){
	return "Hello World", nil
}

func main() {
	// Wrap the handler with wfAgent.WrapHandler()
	lambda.Start(wfAgent.WrapHandler(handler))
}
I used a slightly modified version of the Go code, which is available on GitHub too, which also reports the memory usage of the Lambda function. Apart from adding the code to your Lambda function, you’ll also need to add two environment variables to your deployment:
WAVEFRONT_URL: The URL of your Wavefront instance (like,https://myinstance.wavefront.com).WAVEFRONT_API_TOKEN: Your Wavefront API token (see the docs how to create an API token).
The Pulumi deployment adds these two environment variables to the arguments needed to create the function. In the Payment service, the environment variables are created on lines 156 and 157 and the environment variables are added to the function on line 171. Once you deploy that function, data starts flowing into Wavefront every time the function is executed.
Generating some load
Now that the functions can send data to Wavefront, it’s time to send some load through it. There are tons of load testing tools available, so you should absolutely choose the one that’s right for you. I chose a Go-based variant of Gatling called Gotling. To not completely overwhelm the amount of data in the graphs, the below YAML only executes two functions (get all products and get product). Based on the first call, a random product ID is chosen for the second call. Using random data is often a good idea to limit the amount of caching.
---
iterations: 20
users: 2
rampup: 2
actions:
  - http:
      title: Get all products
      method: GET
      url: https://<api id>.execute-api.us-west-2.amazonaws.com/Prod/products
      accept: json
      response:
        jsonpath: $.data[*].id
        variable: product
        index: random
  - sleep:
      duration: 3
  - http:
      title: Get a single random products
      method: GET
      url: https://<api id>.execute-api.us-west-2.amazonaws.com/Prod/products/${product}
      accept: json
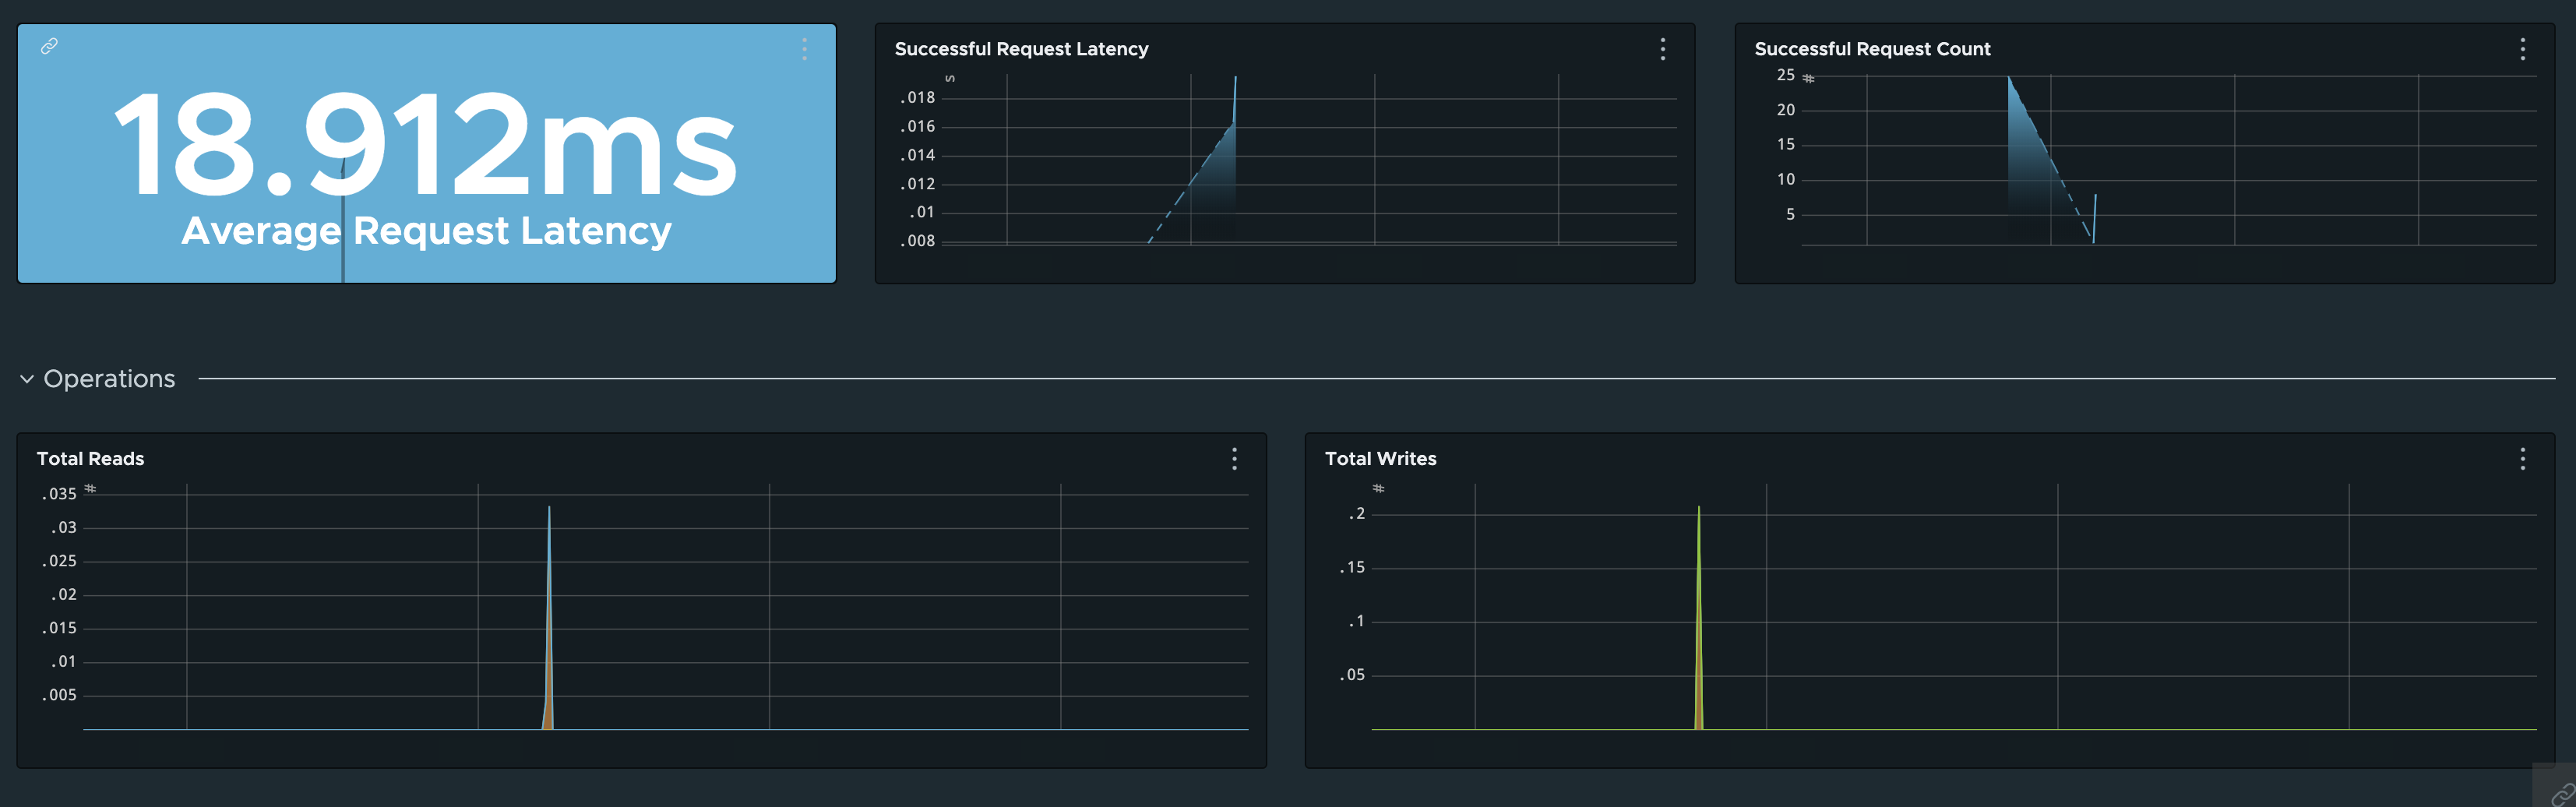
Graphs
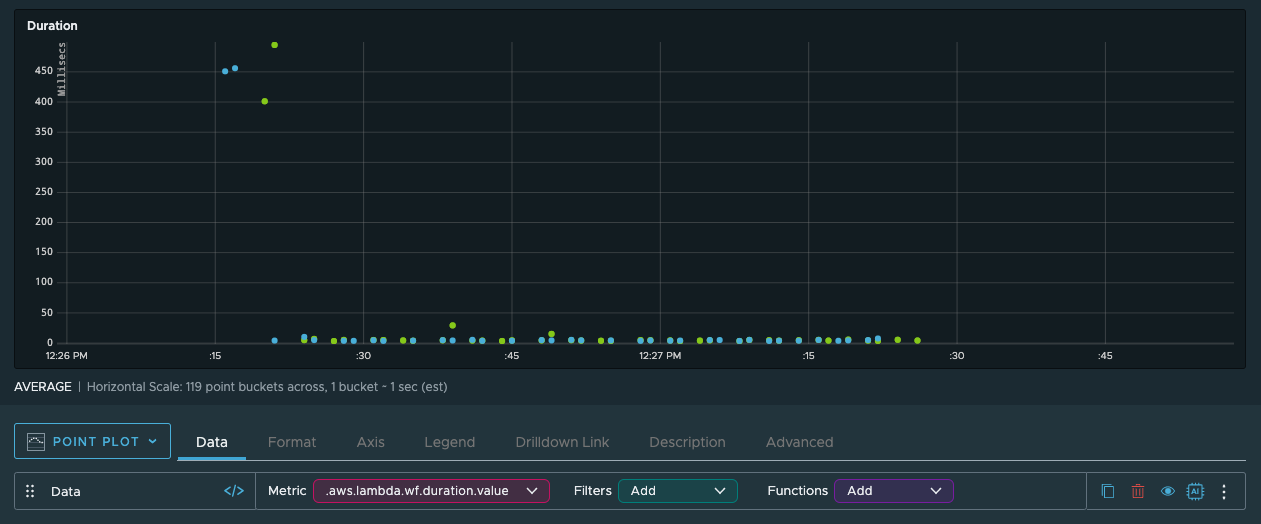
With the metrics data in VMware Tanzu Observability by Wavefront, you can start to “observe” what’s going on in your system and how your system reacts. For example, looking at the duration of the Lambda functions shows that the first executions take a lot longer than the rest but still “only” take about 450 milliseconds. Those outliers are the cold starts within Lambda, and now that I know how long it takes I can decide whether I need to optimize my code or not. The rest of the invocations, though, are all well below the 100-millisecond billing threshold.
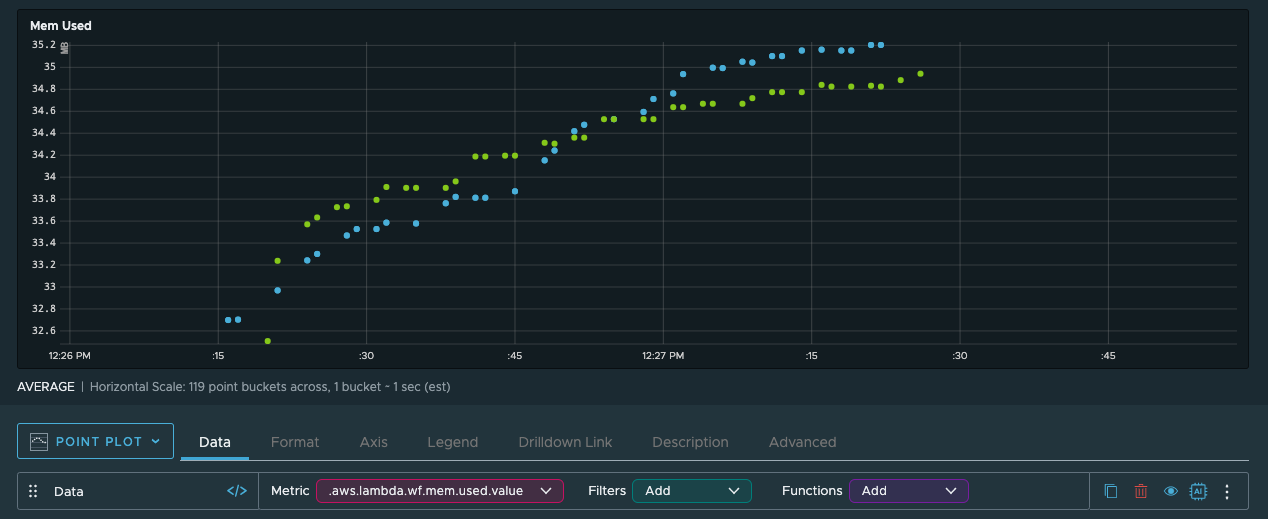
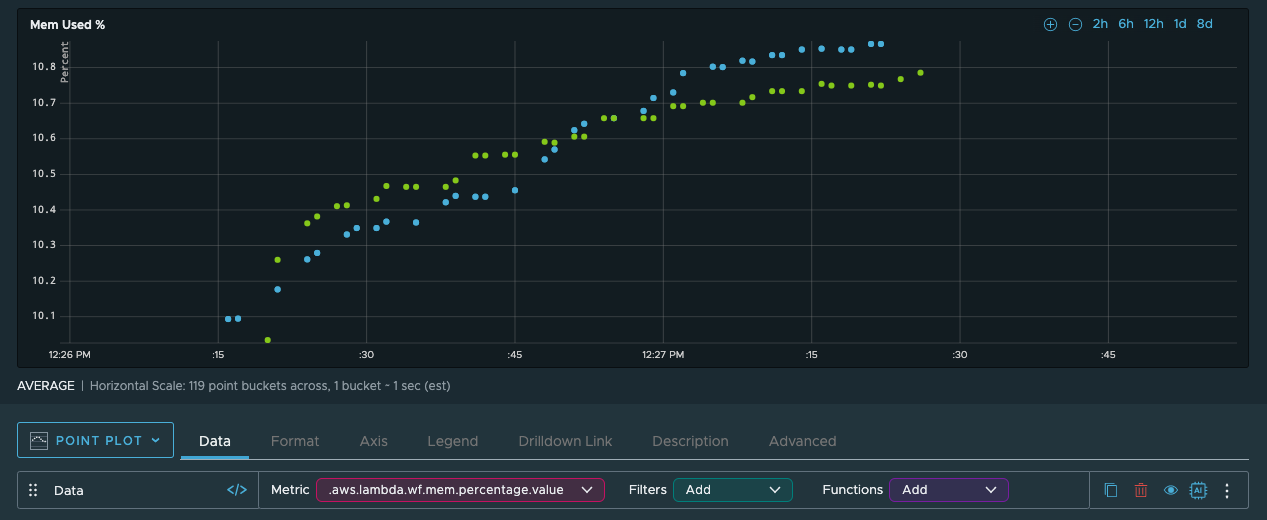
The memory usage ranges between 32 and 36 MB. The functions all have 256 megabytes of memory available, so that shouldn’t be a problem at all. Because we’re also well within the 100-millisecond billing threshold, there’s no real incentive to powertune these functions.
AWS Lambda isn’t the only part of the ACME Serverless Fitness Shop. VMware Tanzu Observability by Wavefront can monitor all the infrastructure and app metrics that AWS and your apps send it. For example, it can report on the number of items your DynamoDB query returns or the capacity units it needs while executing your query. It can report the number of messages in SQS queues or the oldest message.
All that available data also brings me to one of my favorite features in Wavefront, Alerts. Rather than asking the system engineers to look at screens all day long, they can set up alerts when things happen (like too many messages in a queue or too many used read units in a query). The teams can use the data, together with traces, logs, and possibly errors, to make updates to the code.
What’s next?
We’ve looked at what role VMware Tanzu Observability by Wavefront plays in the ACME Serverless Fitness Shop. Let us know what you would like to see next! In the meanwhile, let me know your thoughts.
Cover image by ThisIsEngineering from Pexels