Tracking Distributed Errors In Serverless Apps
Dive into the world of microservices with newfound freedom and challenges. Discover how tools like Sentry.io empower developers to navigate the complexities of error tracking in serverless applications, unraveling the intricacies of the ACME Fitness Shop journey.

Microservices give us as developers an incredible amount of freedom. We can choose our language and we can decide where and when to deploy our service. One of the biggest challenges with microservices, though, is figuring out how things go wrong. With microservices, we can build large, distributed applications, but that also means finding what goes wrong is challenging. It’s even harder to trace errors when you use a platform like AWS Lambda.
As good developers, we write our unit tests and integration tests and we make sure those tests all pass. Together with the Quality Assurance team, we write complex test scenarios to make sure our code behaves the way we intended. The one thing, though, we can never predict is how our end-users will use the software. There are always new issues we didn’t think would happen. That is why tools like Sentry.io are incredibly useful. Sentry.io, which is an application monitoring platform, gives real-time insight into all events logged by developers. Those events can be errors, but they can also be other types of events.
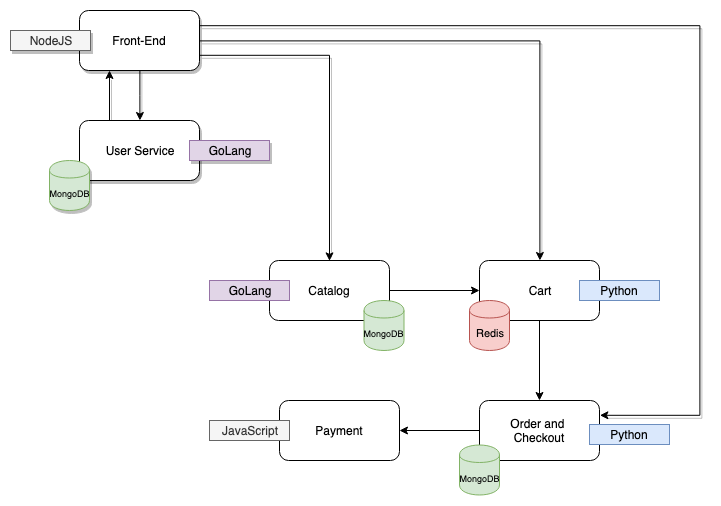
As applications grow, and become a lot more complex, the time it takes to figure out where things go wrong increases too. As you rearchitect apps to be event-driven and make use of serverless compute, that complexity will increase even further. One of the apps we built to help showcase the things we work on as a team is the ACME Fitness Shop. The ACME Fitness Shop consists of six microservices, all running in their own containers and using their own data stores.
wrote on the topic of observability and how to get from just metrics to observability.
Over the past months, the CloudJourney.io team has worked on a serverless version of the ACME Fitness Shop. Currently, the serverless version has 24 Lambda functions that work together. Keeping track of what they all do and where things fall apart is tough. Rather than having a single container that does all the “cart stuff”, there are now eight different Lambda functions.
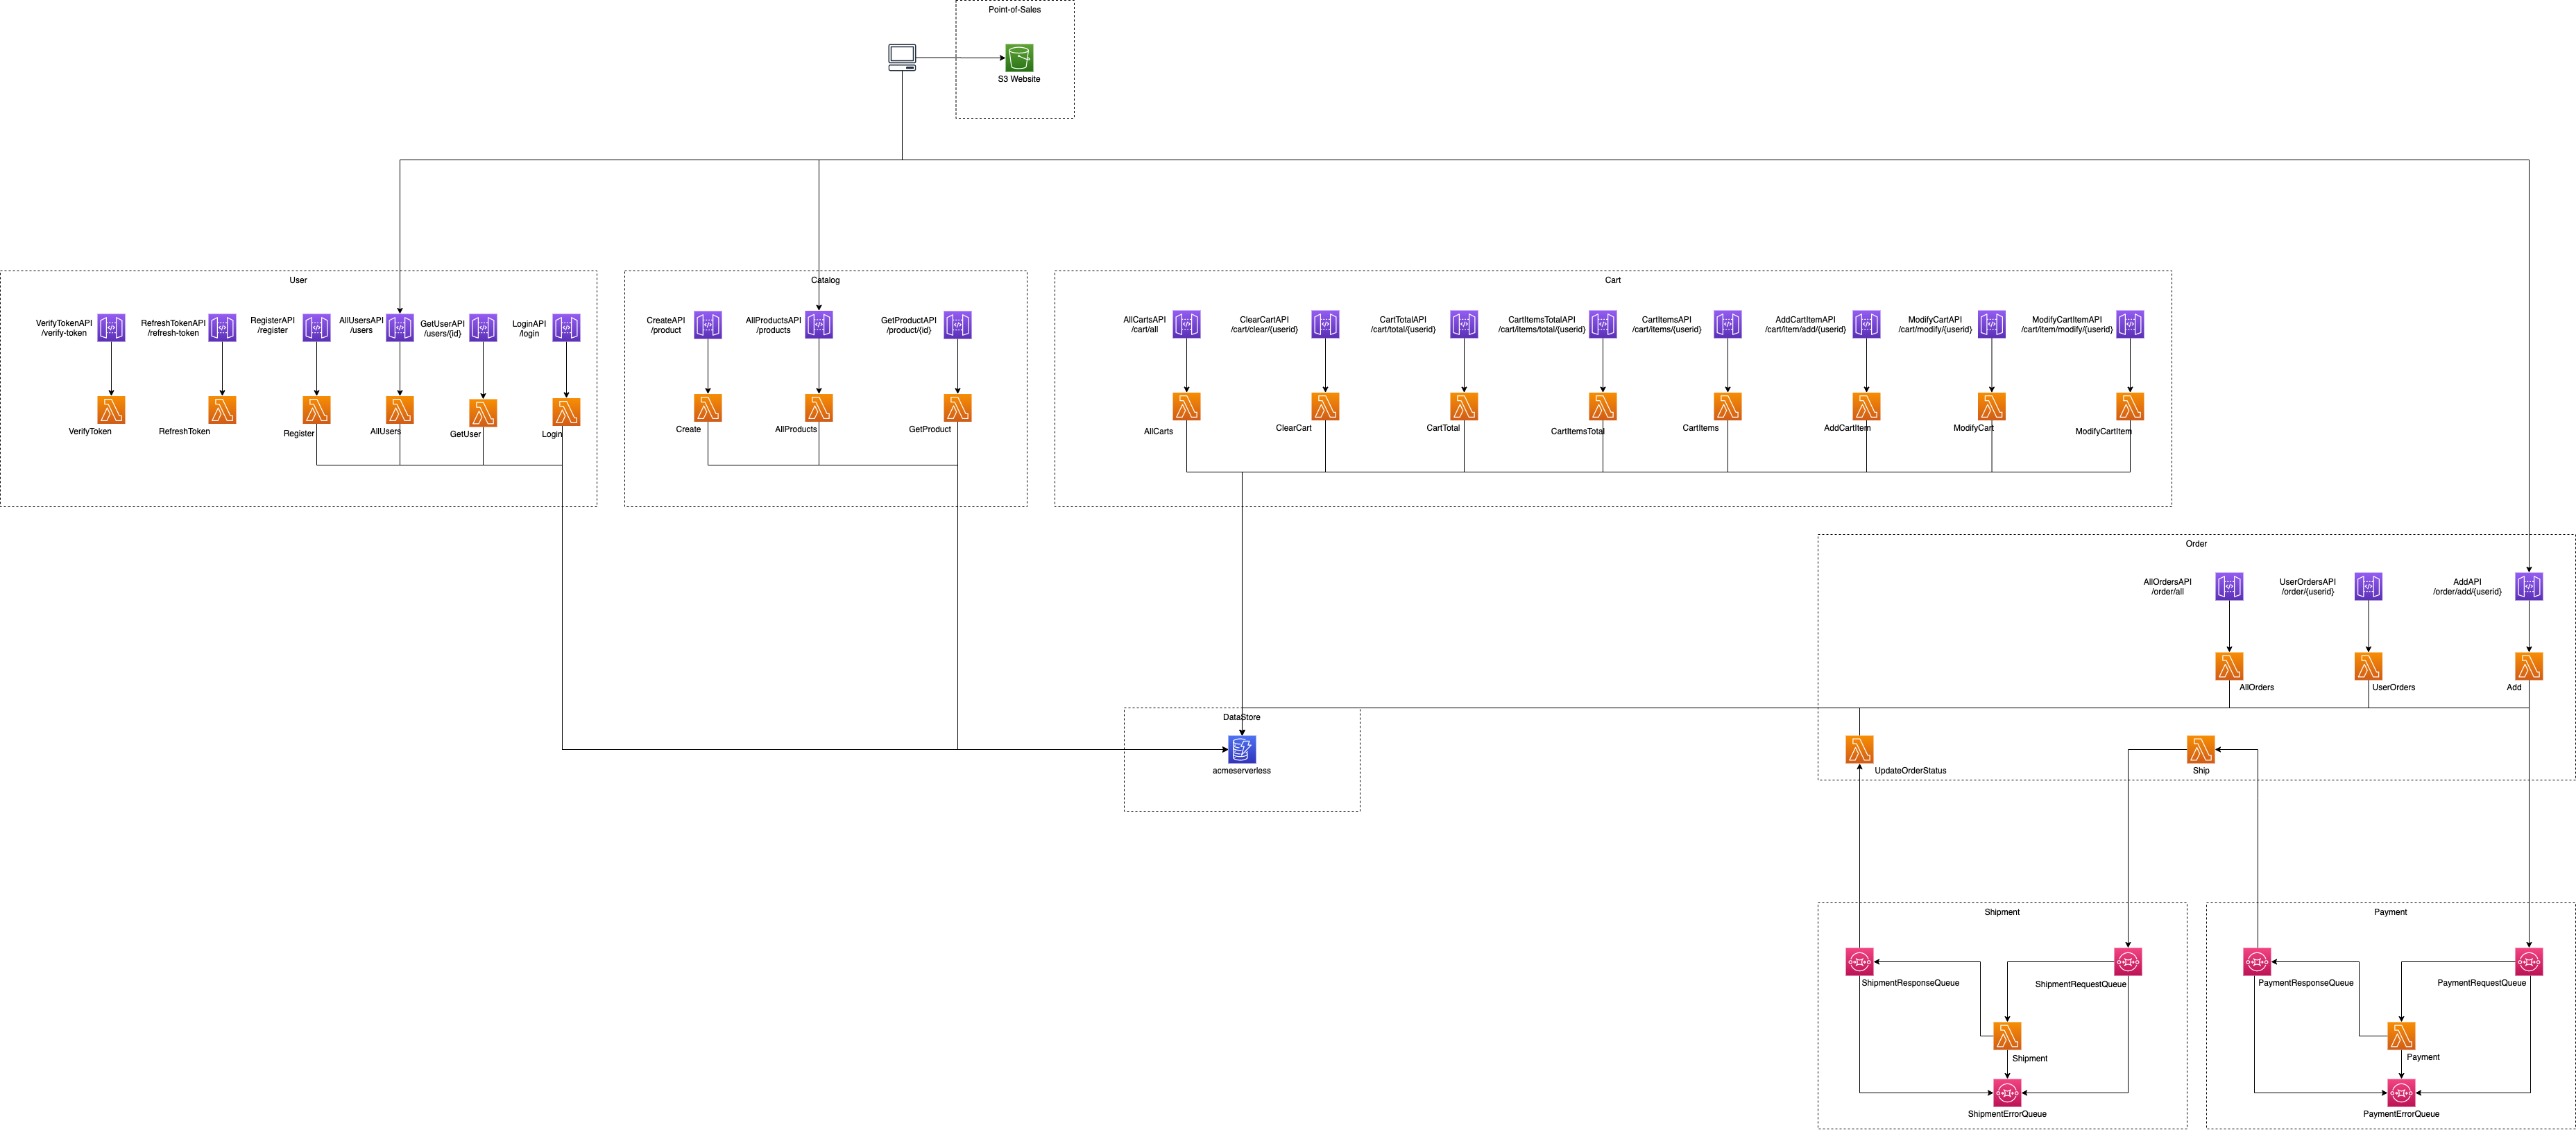
The Lambda functions in the above diagram do the same as their container-based counterparts in the first image. In fact, you could swap the container-based services with the serverless services and never really know the difference. While we can have different teams working on different parts of the same group of functionality, we did add a bit of complexity when it comes to troubleshooting and finding errors. Especially with serverless, you can’t open up a terminal session and “ssh into a container”.
Instrumenting Error handling
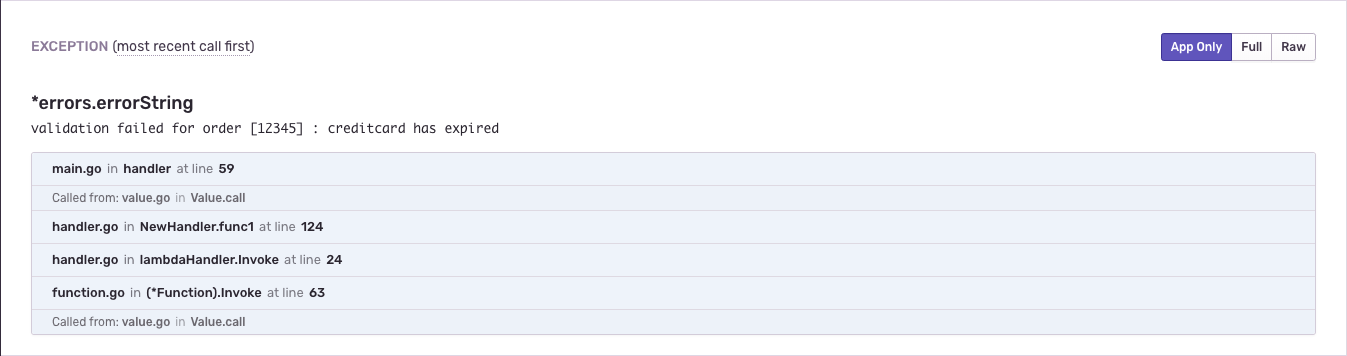
One of the most commonly used tools to report on errors is Sentry.io. Sentry allows developers to instrument their apps to detect errors in real-time. To me, one of the features that stands out is that it also captures where in the source code the error occurred (with a code snippet).
First things, first though. To connect to Sentry, the only required value is the client key which Sentry calls the DSN. To keep that value secure, and definitely follow best practices, you can store it in the AWS Systems Manager Parameter Store (SSM) and use it while deploying your app using CloudFormation (or SAM). SSM lets you create hierarchical groups for your parameters. Using that hierarchical feature, we’ve called the parameter /Sentry/Dsn in SSM. In CloudFormation templates you can use the parameter, like:
Parameters:
  SentryDSN:
    Type: AWS::SSM::Parameter::Value<String>
    Default: /Sentry/Dsn
Capturing events
Most serverless platforms will close all network connections as soon as the function is completed and won’t wait for confirmation. To make sure that all events are received by Sentry, you can configure a synchronous HTTP transport. Together with a few additional settings, the connection to Sentry is configured as:
sentrySyncTransport := sentry.NewHTTPSyncTransport()
sentrySyncTransport.Timeout = time.Second * 3

sentry.Init(sentry.ClientOptions{
    Dsn: os.Getenv("SENTRY_DSN"), // The DSN, coming from the AWS Systems Manager Parameter Store
    Transport: sentrySyncTransport,
    ServerName: os.Getenv("FUNCTION_NAME"), // The name of the function so it can be easily found in Sentry's UI
    Release: os.Getenv("VERSION"), // The version of the deployment so it can be found in GitHub
    Environment: os.Getenv("STAGE"), // The stage, so you can see if it is test or production
})
Sentry offers a bunch of useful events that you can send to help understand what goes on in your app:
- Breadcrumbs: a series of events that occurred before an error or message;
- Exception: an error that has occurred;
- Message: a log message with additional information about an event or an error.
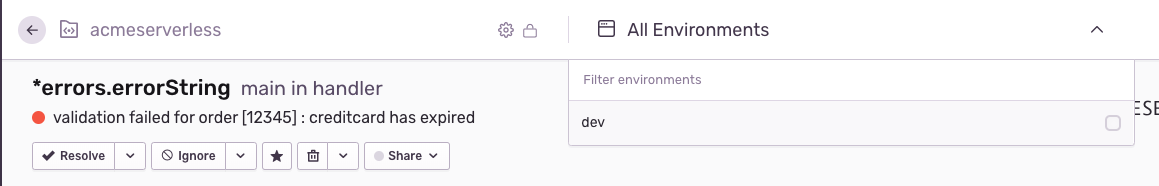
Within the Payment service, the credit card data is validated to make sure it’s a valid credit card. When an order doesn’t have a valid credit card, the rest of the flow will halt as well so that’s an error you want to capture.
sentry.CaptureException(fmt.Errorf("validation failed for order [%s] : %s", req.Request.OrderID, err.Error()))
This is an error you will find during your unit and integration tests, but since it highly impacts your user experience you likely want to keep track of it during production too.
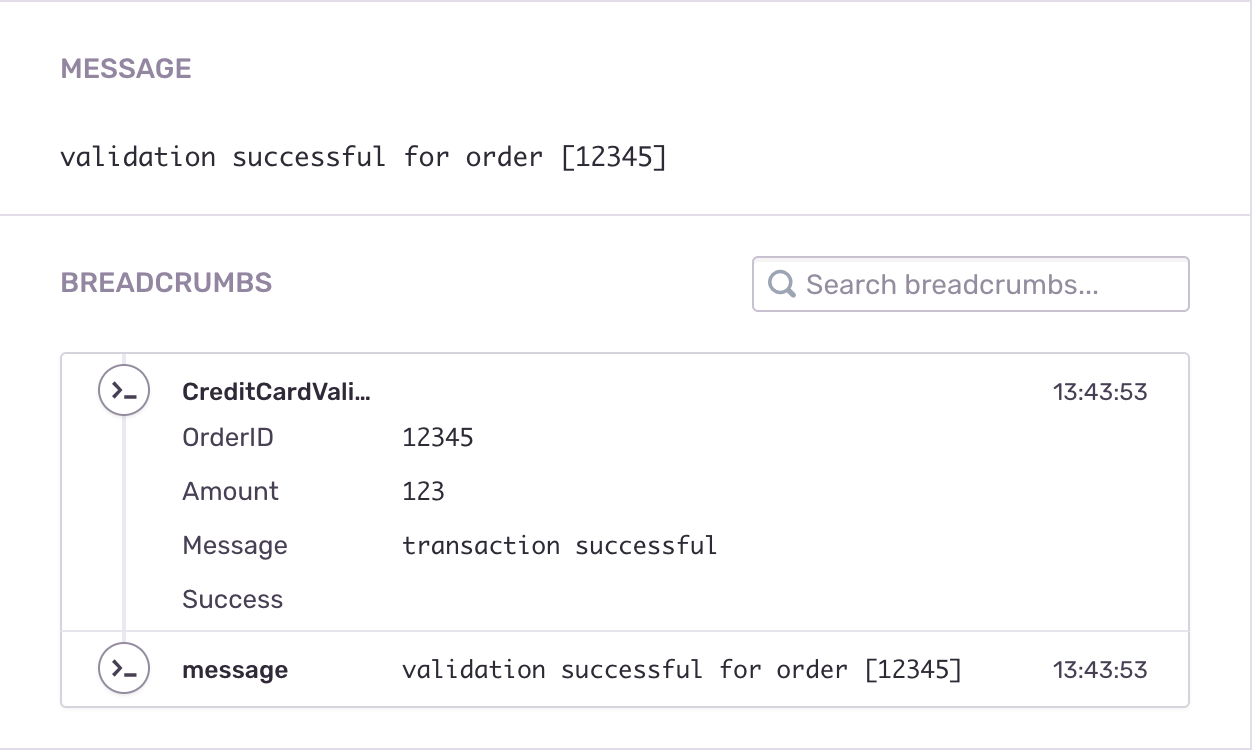
The opposite is possible as well. If you want to capture successful invocations of your app, you can do that too. In this particular case, I’d say the invocation was a success when the credit card was successfully validated, and the message was successfully sent to where it needs to go (in this case an SQS queue). With a single statement, you can send an event to Sentry that captures the success of the Lambda function.
sentry.CaptureMessage(fmt.Sprintf("validation successful for order [%s]", req.Request.OrderID))
Keeping track of data
In both cases, keeping track of additional data is important. That additional data could mean the difference between spending two minutes looking at a single service or spending the entire day figuring out which services were impacted. The breadcrumbs play an essential role here. The amount, the order number, and the generated transaction ID are useful in this context. This data is also really useful if there is an error in the Shipping service. For example, when an order should have been sent to the Shipping service but is never picked up by the Lambda function, you can easily trace where the issue is. Adding this data is done through breadcrumbs, like:
crumb := sentry.Breadcrumb{
    Category: "CreditCardValidated",
    Timestamp: time.Now().Unix(),
    Level: sentry.LevelInfo,
    Data: map[string]interface{}{
        "Amount": req.Request.Total,
        "OrderID": req.Request.OrderID,
        "Success": true,
        "Message": "transaction successful",
    },
}

// ...(snip)

sentry.AddBreadcrumb(&crumb)
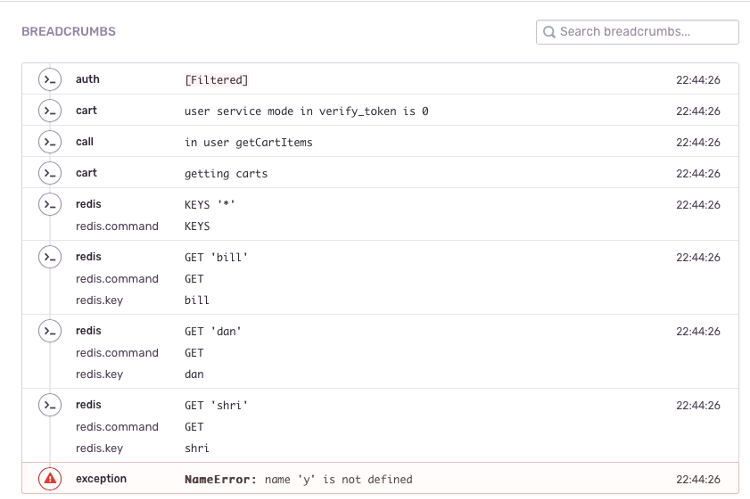
Up to now, we’ve looked at the serverless components og the ACME Fitness Shop. As mentioned, there is a container version too and you could mix and match parts. This is where tracing and knowing where errors occur is crucial. Rather than just looking at logs in one place, you would need to look at both your serverless logs and Kubernetes logs. Within the Python based cart service, we’ve added the redis integration too. Simply adding a single line, and an import statement, makes that all the redis commands that are executed show up too.
import sentry_sdk
from sentry_sdk.integrations.redis import RedisIntegration

sentry_sdk.init(
    dsn='https://<key>@sentry.io/<project>',
    integrations=[RedisIntegration()]
)
Rather than spending time figuring out where the issue is and how certain data got translated into a redis command, you can literally just read what happened.
As your application moves from dev, to test, and to production, the environment tag will help you keep track of what happens in which environment. Issues that happen in the test environment are less urgent than ones that happen in production. One of the tags we’ve set up is called “release”, which is the SHA of the git commit. Based on that, we can track the exact commit that’s running in any environment at any given time and see the events that have been captured.
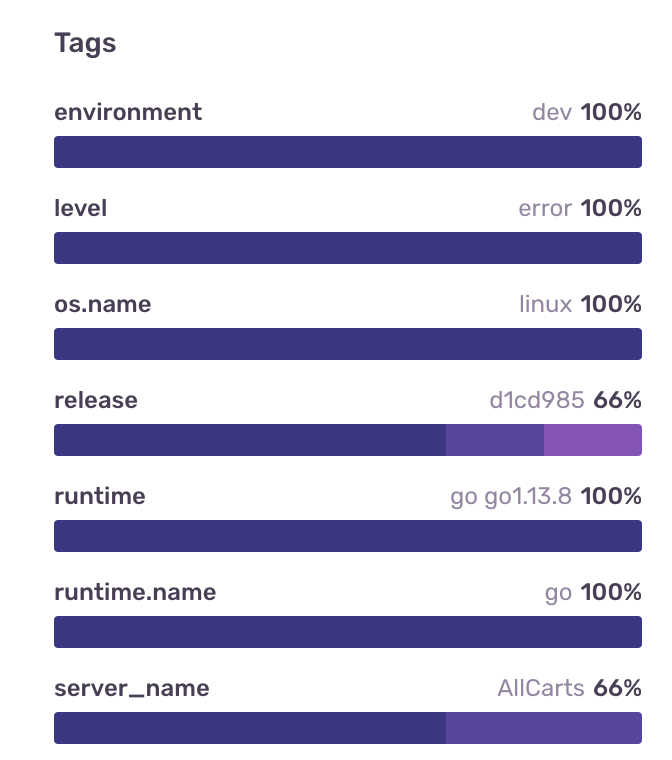
These tags, when tied to specific scopes, can even allow you to correlate messages together. That gives you the power to see what all went on in your system at the time an error occurred. Some great examples, including tracing from the Nginx load balancer in front of your app, can be found in the Sentry docs.
What’s next?
The containers and Kubernetes manifests for the ACME Fitness Shop are on GitHub and so it the code for the ACME Serverless Fitness Shop. So if you want to try it out and see whether Sentry.io adds value to your use cases as well, you can do exactly that using the code and apps we’ve already built. In the meanwhile, let us know your thoughts and send Bill, Leon, or the team a note on Twitter.
Photo by John Schnobrich on Unsplash