
In the age of monolithic apps and app servers, monitoring was relatively straightforward. With microservices, you’re dealing with more servers and more services, and monitoring gets complex fast. You have options — Nagios, Zabbix, or Prometheus. My preference goes to the Greek deity that stole fire from Mount Olympus and brought it to us.
Deity? Prometheus #
From the Prometheus website:
(…) an open-source systems monitoring and alerting toolkit originally built at SoundCloud. Since its inception in 2012, many companies and organizations have adopted Prometheus, and the project has a very active developer and user community.
As SoundCloud moved to microservices they needed to monitor thousands of services, and their existing monitoring had too many limitations. The Prometheus website adds:
It is now a standalone open source project and maintained independently of any company. To emphasize this and clarify the project’s governance structure, Prometheus joined the Cloud Native Computing Foundation in 2016 as the second hosted project after Kubernetes.
Prometheus architecture #
Prometheus was designed with 4 main requirements:
- A multi-dimensional data model, so that data can be sliced and diced at will, along dimensions like instance, service, endpoint, and method.
- Operational simplicity, so that you can spin up a monitoring server where and when you want, even on your local workstation, without setting up a distributed storage backend or reconfiguring the world.
- Scalable data collection and decentralized architecture, so that you can reliably monitor the many instances of your services, and independent teams can set up independent monitoring servers.
- Finally, a powerful query language that leverages the data model for meaningful alerting (including easy silencing) and graphing (for dashboards and for ad-hoc exploration).

There are many good explanations of the individual components out there, so I’ll leave that to those resources.
Building a Node.js app #
Before we get into Prometheus configuration, we need a service to monitor. I’ll walk through what you need to add to your Node.js apps to start monitoring them with Prometheus. I’m assuming you’ve created an API spec in TIBCO Cloud Integration and exported the Node.js code. If not, the tutorial on the TIBCO Community will get you started (or just grab the code from my GitHub repo ;-)).
Adding dependencies to package.json #
We need a Prometheus client for Node.js that supports histograms, summaries, gauges, and counters. Prometheus recommends prom-client:
npm install --save prom-clientWe also want response time tracking, so we need a middleware that records response times for HTTP requests:
npm install --save response-timeCreating a module #
Following Node.js best practices, we’ll create a separate module for all the Prometheus instrumentation. It’s a fair amount of JavaScript, but I’ve documented it thoroughly.
/**
 * Newly added requires
 */
var Register = require('prom-client').register;
var Counter = require('prom-client').Counter;
var Histogram = require('prom-client').Histogram;
var Summary = require('prom-client').Summary;
var ResponseTime = require('response-time');
var Logger = require('./logger');

/**
 * A Prometheus counter that counts the invocations of the different HTTP verbs
 * e.g. a GET and a POST call will be counted as 2 different calls
 */
module.exports.numOfRequests = numOfRequests = new Counter({
    name: 'numOfRequests',
    help: 'Number of requests made',
    labelNames: ['method']
});

/**
 * A Prometheus counter that counts the invocations with different paths
 * e.g. /foo and /bar will be counted as 2 different paths
 */
module.exports.pathsTaken = pathsTaken = new Counter({
    name: 'pathsTaken',
    help: 'Paths taken in the app',
    labelNames: ['path']
});

/**
 * A Prometheus summary to record the HTTP method, path, response code and response time
 */
module.exports.responses = responses = new Summary({
    name: 'responses',
    help: 'Response time in millis',
    labelNames: ['method', 'path', 'status']
});

/**
 * This funtion will start the collection of metrics and should be called from within in the main js file
 */
module.exports.startCollection = function () {
    Logger.log(Logger.LOG_INFO, `Starting the collection of metrics, the metrics are available on /metrics`);
    require('prom-client').collectDefaultMetrics();
};

/**
 * This function increments the counters that are executed on the request side of an invocation
 * Currently it increments the counters for numOfPaths and pathsTaken
 */
module.exports.requestCounters = function (req, res, next) {
    if (req.path != '/metrics') {
        numOfRequests.inc({ method: req.method });
        pathsTaken.inc({ path: req.path });
    }
    next();
}

/**
 * This function increments the counters that are executed on the response side of an invocation
 * Currently it updates the responses summary
 */
module.exports.responseCounters = ResponseTime(function (req, res, time) {
    if(req.url != '/metrics') {
        responses.labels(req.method, req.url, res.statusCode).observe(time);
    }
})

/**
 * In order to have Prometheus get the data from this app a specific URL is registered
 */
module.exports.injectMetricsRoute = function (App) {
    App.get('/metrics', (req, res) => {
        res.set('Content-Type', Register.contentType);
        res.end(Register.metrics());
    });
};
Adding code to server.js #
In server.js you only need a few lines:
'use strict';

...
/**
 * This creates the module that we created in the step before.
 * In my case it is stored in the util folder.
 */
var Prometheus = require('./util/prometheus');
...

/**
 * The below arguments start the counter functions
 */
App.use(Prometheus.requestCounters);
App.use(Prometheus.responseCounters);

/**
 * Enable metrics endpoint
 */
Prometheus.injectMetricsRoute(App);

/**
 * Enable collection of default metrics
 */
Prometheus.startCollection();
...
Five lines of code in server.js and your app is instrumented.
Deploy #
Push the app to TIBCO Cloud Integration using either the tibcli utility or the Visual Studio Code extension. More details in the TCI docs or in this post on the TIBCO Community. After deploying, grab the URL of your app — you’ll need it for Prometheus. For example: https://integration.cloud.tibcoapps.com/ijdc72jg2ugg2dikkkl236f2rhma6qaz.
Running Prometheus #
There are many ways to run Prometheus, but Docker is probably the easiest. No installation headaches, no dependency management. You just need to tell Prometheus which endpoint to monitor via a prometheus.yml file that you bind-mount from the host.
Prometheus needs a hostname and port for its targets, which makes monitoring apps on iPaaS/PaaS platforms a bit trickier. The metrics_path parameter per job handles this by telling Prometheus to hit a specific path on the server.
A basic but functional prometheus.yml:
global:
  scrape_interval: 1m
  scrape_timeout: 10s
  evaluation_interval: 1m
rule_files:
- /etc/prometheus/alert.rules
scrape_configs:
- job_name: PrometheusApp
  scrape_interval: 5s
  scrape_timeout: 5s
  metrics_path: /ijdc72jg2ugg2dikkkl236f2rhma6qaz/metrics
  scheme: https
  static_configs:
  - targets:
    - integration.cloud.tibcoapps.com
    labels:
      app: PrometheusApp
      sandbox: MyDefaultSandbox
I’ve set the job_name and the label app to match my app name in TCI for easy correlation. The metrics_path contains the app URL path plus /metrics.
Start the Docker container:
docker run -p 9090:9090 -v /path/to/prometheus.yml:/etc/prometheus/prometheus.yml prom/prometheusLooking at Prometheus data #
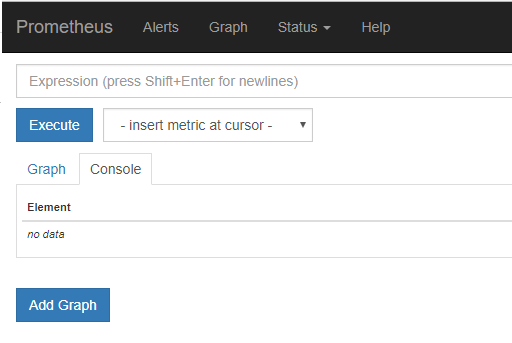
Open Prometheus at http://localhost:9090/graph and enter the expression up:
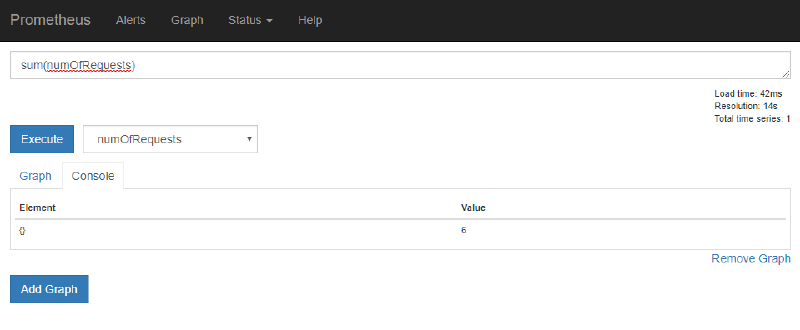
That checks whether your app is running. sum(numOfRequests) gives you the total request count:
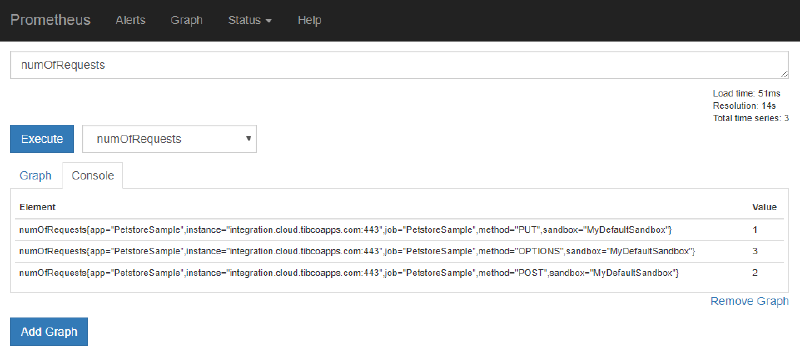
Without sum() you get a breakdown by HTTP verb:
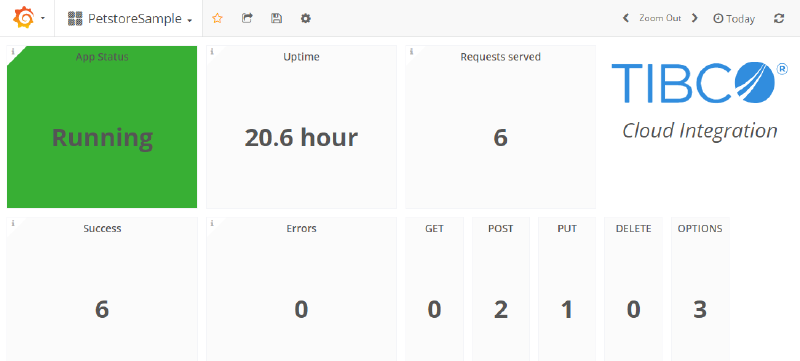
Reporting with Grafana #
Grafana can take the data from Prometheus and present it in dashboards. You can build views showing app status, request counts, and request type breakdowns:
Wrapping up #
Prometheus lets you monitor the health and status of your Node.js apps on TIBCO Cloud Integration (or anywhere else), and Grafana gives you custom dashboards on top of that data. The combination works well for any app that can expose or push metrics to Prometheus.